After posting “A Family History of Heart Disease is Total BS” and uploading my “Heart Disease Deception” video on YouTube, I’ve had many questions regarding the best tests for determining your cardiovascular risk. And similarly, what biomarkers to look at when trying to assess your insulin sensitivity, and risk of diabetes and dementia.

If you haven’t reviewed that post, or watched the video, I recommend starting there and/or checking out my books. Once that’s done, here are the tests to ask for and numbers to look at with your doctor:
CARDIOVASCULAR DISEASE
1. Triglyceride to HDL Ratio – Best predictor of heart disease
> 6 = Deadly
> 4 = High
< 2 = Ideal
2. LDL Composition – Still a somewhat new biomarker for heart disease at the time of writing this post, so many doctors may not have the tools. Ask for: NMR LipoProfile, LipoPrint, Berkeley (from Berkely Heart Lab), or VAP (Vertical Auto Profile).
Small & Dense = Bad – 3-fold greater risk of heart disease
Big & Fluffy = Good
3. Homocysteine – Elevated levels are correlated with increased risk of diseases of the heart and brain.
14+ = Really Bad
Over 10 = Elevated
8mmol/L or less = Healthy
4. C-reactive Protein – Measure of inflammation in the body, and good predictor of heart disease.
Above 3.0mg/L = Bad
0-3.0mg/L = Healthy
DIABETES
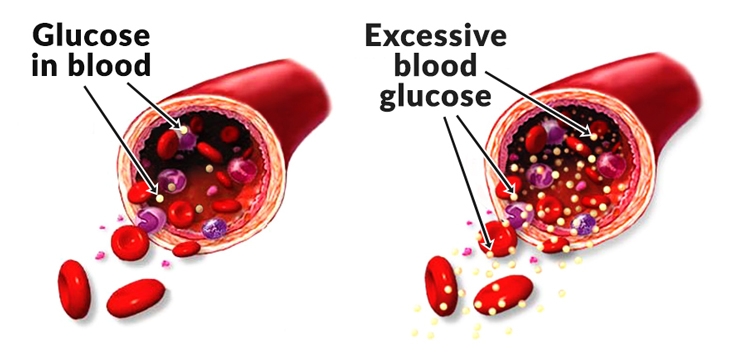
Controlling blood sugar is essential to preventing insulin resistance, which is arguably the first step towards the metabolic syndrome. The more resistant our cells become to glucose, the more likely we are to experience elevated triglycerides and excess fat storage. This raises our risk of diabetes, heart disease, and even dementia. Here are the 3 best options for analyzing your ability to control blood sugar and insulin:
1. Oral Glucose Tolerance Test (OGTT) – To determine the insulin sensitivity or resistance of your cells. Test involves drinking 75g of glucose and having blood taken at 30min, 1hr, 2hr, 3hrs, to see how fast glucose is taken up into tissues. If after 2 hours the value is:
<140mg/dL or 7.8mmol/L = Healthy
140-200mg/dL or 7.8-11.1mmol/L = Impaired
>200mg/dL or 11.1mmol/L = Diabetic
2. Fasting Insulin – To determine your level of insulin resistance. Considered a better predictor than fasting glucose, because ‘normal’ blood sugar could simply mean that the pancreas is working extra hard (pumping out insulin) to normalize blood sugar. For instance, a 2005 study from the Archives of Neurology analyzed fasting insulin from 523 people between the ages of 70 and 90 who had normal blood sugar and were not diabetic, but a significant amount were insulin resistant.
Over 17 = Really bad
Over 10 = Bad
8.4-8.8 = U.S. Average
5.0+ = Elevated
2.0 = Extremely Healthy
3. Fasting Blood Glucose – if you can only get the fasting glucose, here’s the numbers:
>125mg/dL or 7.0mmol/L = Diabetic
101-125mg/dL or 5.5-7.0mmol/L = Impaired
<95mg/dL or 5.5mmol/L = Healthy
DEMENTIA
High blood sugar (hyperglycemia) is proposed as the main contributor to the link between diabetes and a reduction in cognitive ability. Not only from insulin resistant cells and inflammation, but because of sugar molecules binding to proteins in the brain and damaging or oxidizing them. Similar to the way sugar attaches to cholesterol molecules to promote heart disease, these sticky proteins (called AGEs – Advanced Glycation End Products) are how high blood sugar promotes brain shrinkage. Here are 2 tests to determine your ‘AGE-ing’ rate:
1. Hemoglobin A1C – is the protein in red blood cells that attaches to blood sugar (AGEs) and is used predominantly to determine risk of brain diseases, like Alzheimer’s. Although, it’s also proven effective for determining risk of heart disease, diabetes, stroke, and even depression. Worth noting is that improvements in these numbers can take a while.
Above 6.0 = high risk of disease and brain loss
5.0-5.5 = Low risk
Below 5.0 = Extremely healthy
2. Fructosamine – Like hemoglobin A1C, gives us a good idea of AGEs (advanced glycated end-products), as well as average blood sugar control. Expect changes after only 3 or 4 weeks.
185-225mmol/L = healthy
Stay Lean!
Coach Mike

RELATED ARTICLES:
But My Doctor NSAID To Take These